引包
1
2
3
4
5
6
7
8
9
10
11
12
13
14
15
16
# 导入需要的模块
import pandas as pd
import matplotlib.pyplot as plt
import numpy as np

# 用来绘图的,封装了matplot
# 要注意的是一旦导入了seaborn,
# matplotlib的默认作图风格就会被覆盖成seaborn的格式
import seaborn as sns

from scipy import stats
from scipy.stats import  norm
from sklearn.preprocessing import StandardScaler
import warnings
warnings.filterwarnings('ignore')
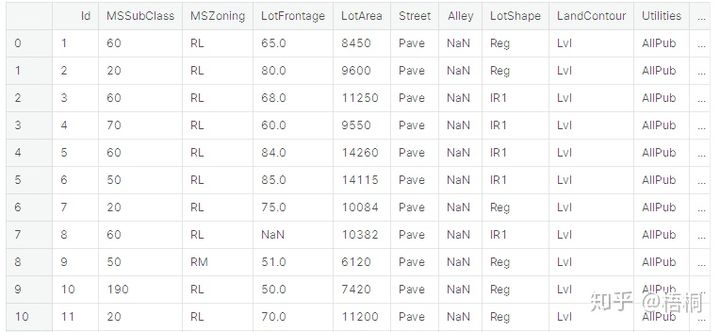
data_train = pd.read_csv("../KaggleDataset/train.csv")
分析各个特征
输出房价的数量、均值、最大值、最小值、方差等特征
1
data_train['SalePrice'].describe()
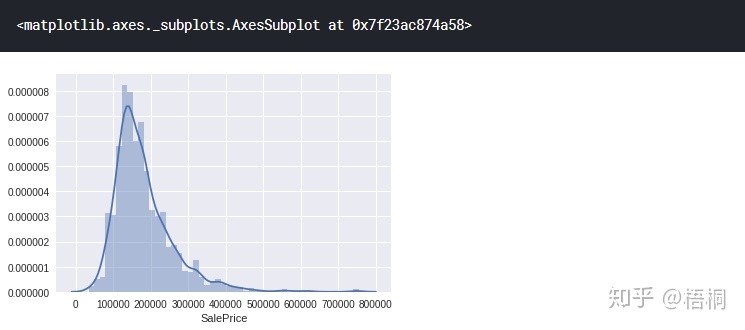
绘制直方图
1
2
sns.distplot(data_train['SalePrice'])
plt.show()
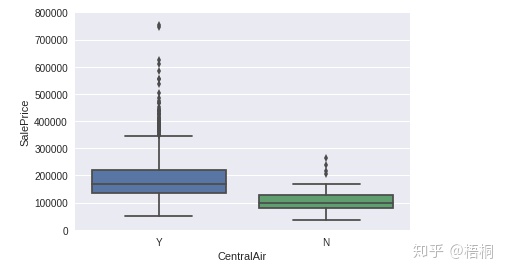
CentralAir中央空调
1
2
3
4
5
# CentralAir
var = 'CentralAir'
data = pd.concat([data_train['SalePrice'], data_train[var]], axis=1)
fig = sns.boxplot(x=var, y="SalePrice", data=data)
fig.axis(ymin=0, ymax=800000);
OverallQual 总体评价
1
2
3
4
5
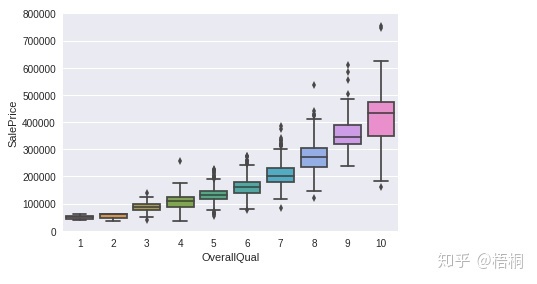
# OverallQual
var = 'OverallQual'
data = pd.concat([data_train['SalePrice'], data_train[var]], axis=1)
fig = sns.boxplot(x=var, y="SalePrice", data=data)
fig.axis(ymin=0, ymax=800000);
YearBuilt 建造年份
1
2
3
4
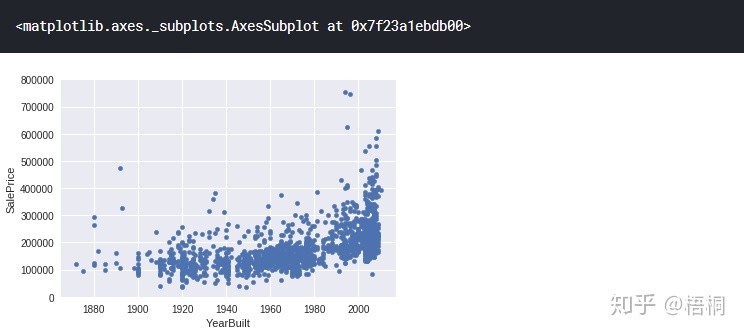
# 散点图
var = 'YearBuilt'
data = pd.concat([data_train['SalePrice'], data_train[var]], axis=1)
data.plot.scatter(x=var, y="SalePrice", ylim=(0, 800000))
Neighborhood 地段
1
2
3
4
5
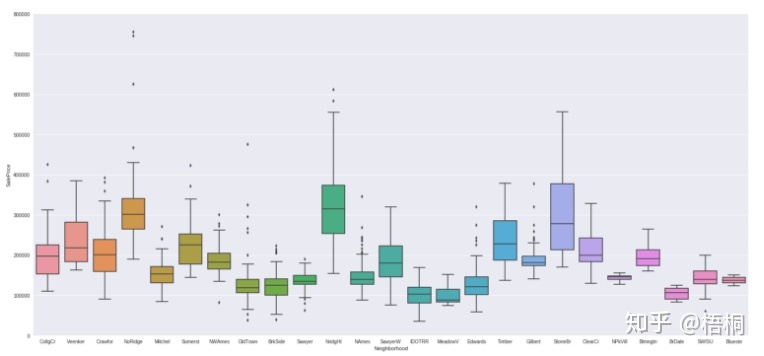
var = 'Neighborhood'
data = pd.concat([data_train['SalePrice'], data_train[var]], axis=1)
f, ax = plt.subplots(figsize=(26, 12))
fig = sns.boxplot(x=var, y="SalePrice", data=data)
fig.axis(ymin=0, ymax=800000);
LotArea 地表面积
1
2
3
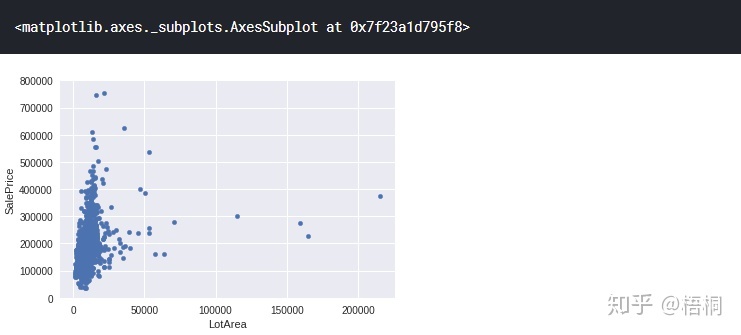
var  = 'LotArea'
data = pd.concat([data_train['SalePrice'], data_train[var]], axis=1)
data.plot.scatter(x=var, y='SalePrice', ylim=(0, 800000))
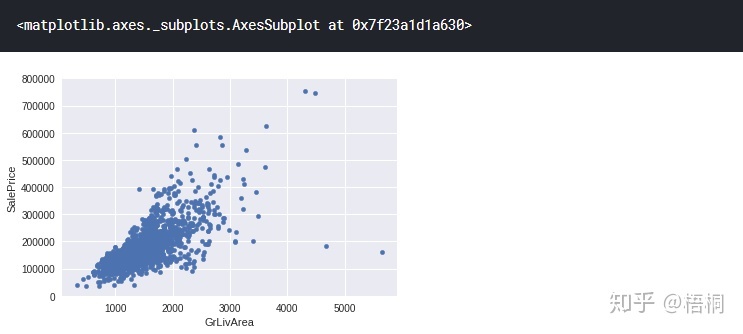
GrLivArea 不含车库的室内面积
1
2
3
var  = 'GrLivArea'
data = pd.concat([data_train['SalePrice'], data_train[var]], axis=1)
data.plot.scatter(x=var, y='SalePrice', ylim=(0, 800000))
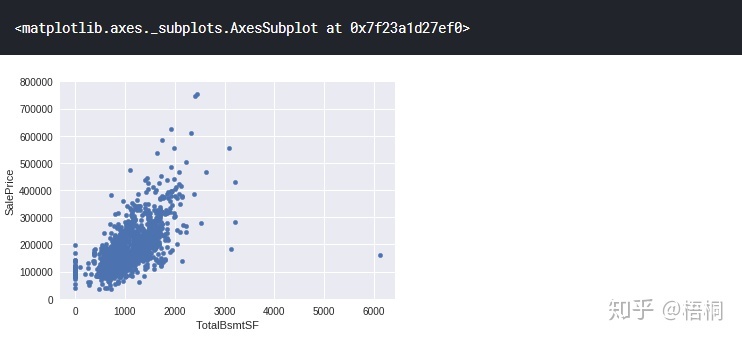
TotalBsmtSF 地下室面积
1
2
3
var  = 'TotalBsmtSF'
data = pd.concat([data_train['SalePrice'], data_train[var]], axis=1)
data.plot.scatter(x=var, y='SalePrice', ylim=(0, 800000))Out [15]:
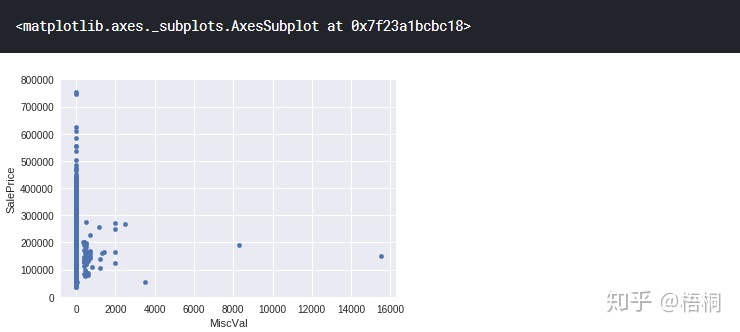
MiscVal 附加资产
1
2
3
var  = 'MiscVal'
data = pd.concat([data_train['SalePrice'], data_train[var]], axis=1)
data.plot.scatter(x=var, y='SalePrice', ylim=(0, 800000))
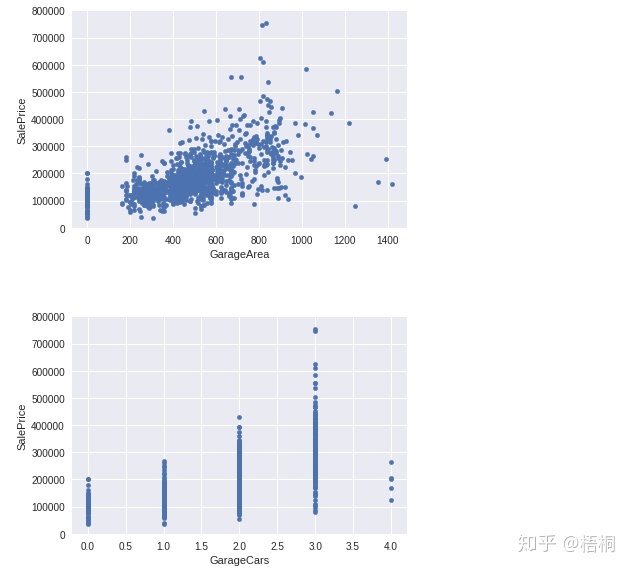
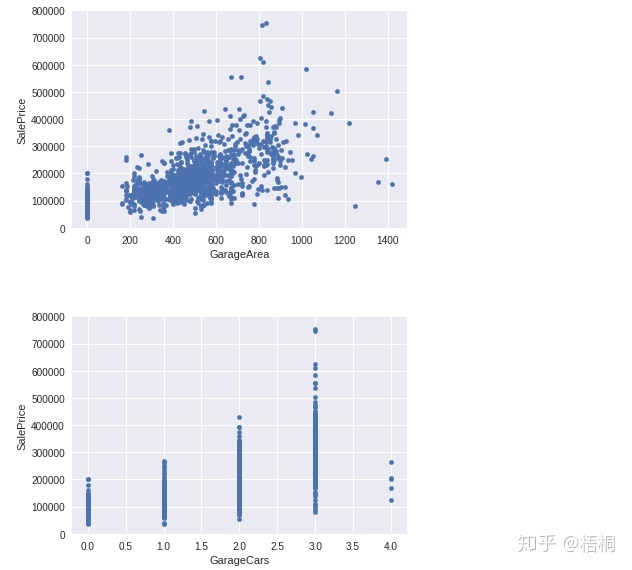
GarageArea/GarageCars 车库面积/车库车辆
1
2
3
4
var  = ['GarageArea', 'GarageCars']
for index in range(2):
    data = pd.concat([data_train['SalePrice'], data_train[var[index]]], axis=1)
    data.plot.scatter(x=var[index], y='SalePrice', ylim=(0, 800000))
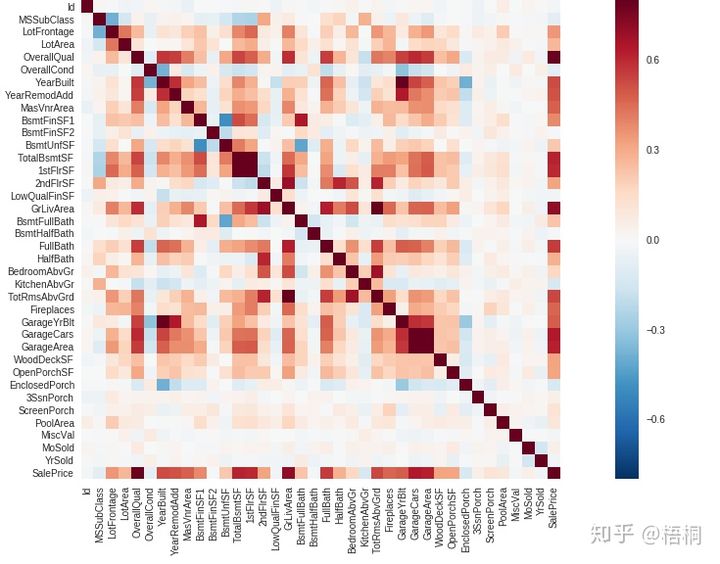
关系矩阵分析特征
1
2
3
corrmat = data_train.corr()
f, ax = plt.subplots(figsize=(20, 9))
sns.heatmap(corrmat, vmax=0.8, square=True)
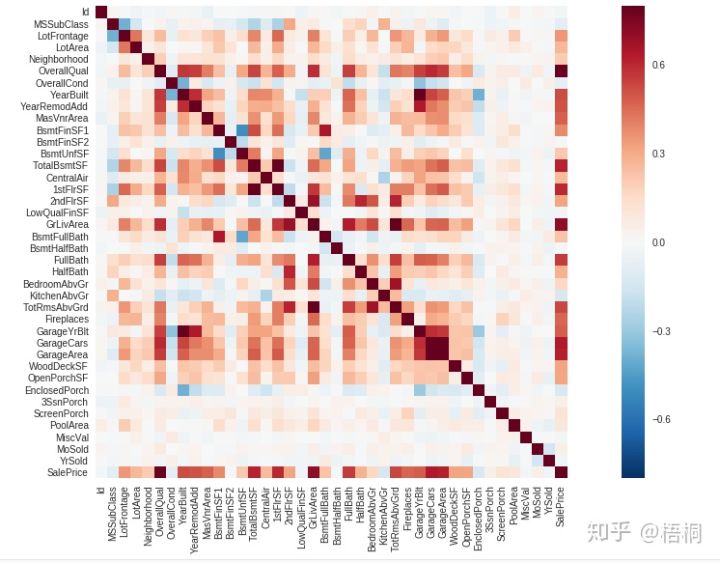
加入Neighborhood这种离散型数据
1
2
3
4
5
6
7
8
from sklearn import preprocessing
f_names = ['CentralAir', 'Neighborhood']
for x in f_names:
    label = preprocessing.LabelEncoder()
    data_train[x] = label.fit_transform(data_train[x])
corrmat = data_train.corr()
f, ax = plt.subplots(figsize=(20, 9))
sns.heatmap(corrmat, vmax=0.8, square=True)
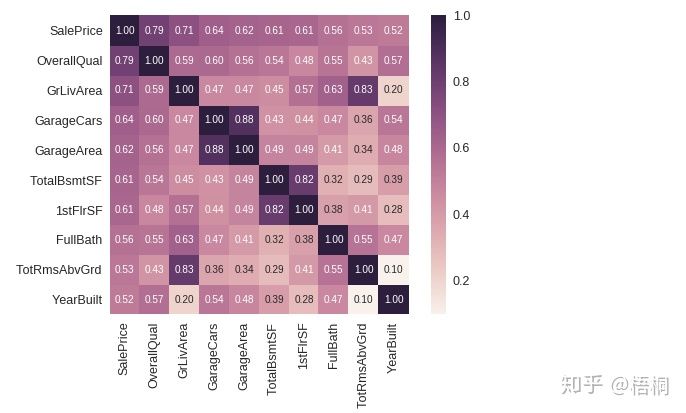
房价关系矩阵
1
2
3
4
5
6
7
k  = 10 # 关系矩阵中将显示10个特征
cols = corrmat.nlargest(k, 'SalePrice')['SalePrice'].index
cm = np.corrcoef(data_train[cols].values.T)
sns.set(font_scale=1.25)
hm = sns.heatmap(cm, cbar=True, annot=True, \
                 square=True, fmt='.2f', annot_kws={'size': 10}, yticklabels=cols.values, xticklabels=cols.values)
plt.show()
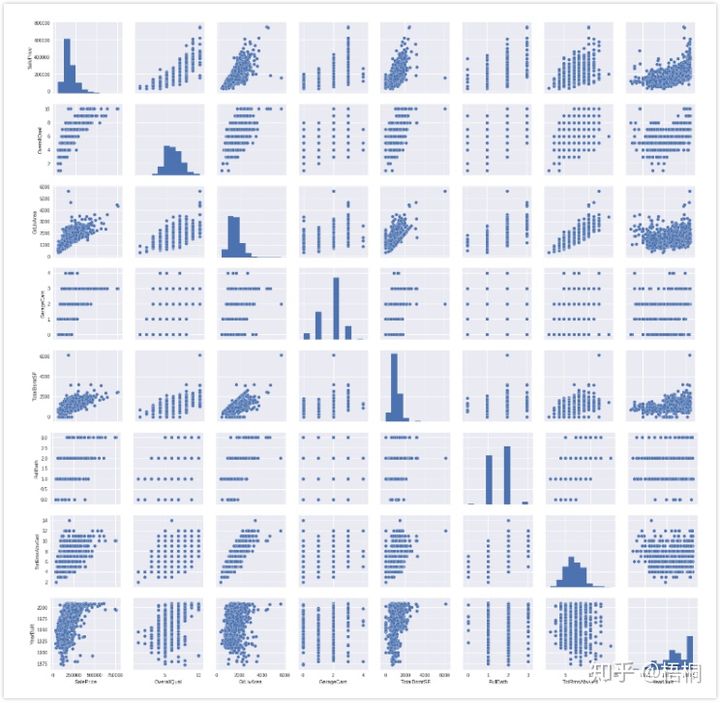
绘制关系图
1
2
3
4
sns.set()
cols = ['SalePrice','OverallQual','GrLivArea', 'GarageCars','TotalBsmtSF', 'FullBath', 'TotRmsAbvGrd', 'YearBuilt']
sns.pairplot(data_train[cols], size = 2.5)
plt.show()
